
01
Map and grid context
Explore buildings with map or satellite views, grid overlays, points of interest and rooftop coverage.
ENERGY & DIGITAL TWINS
An interactive energy workspace brings buildings, solar production and energy assumptions into one map, turning complex energy data into practical planning tools.
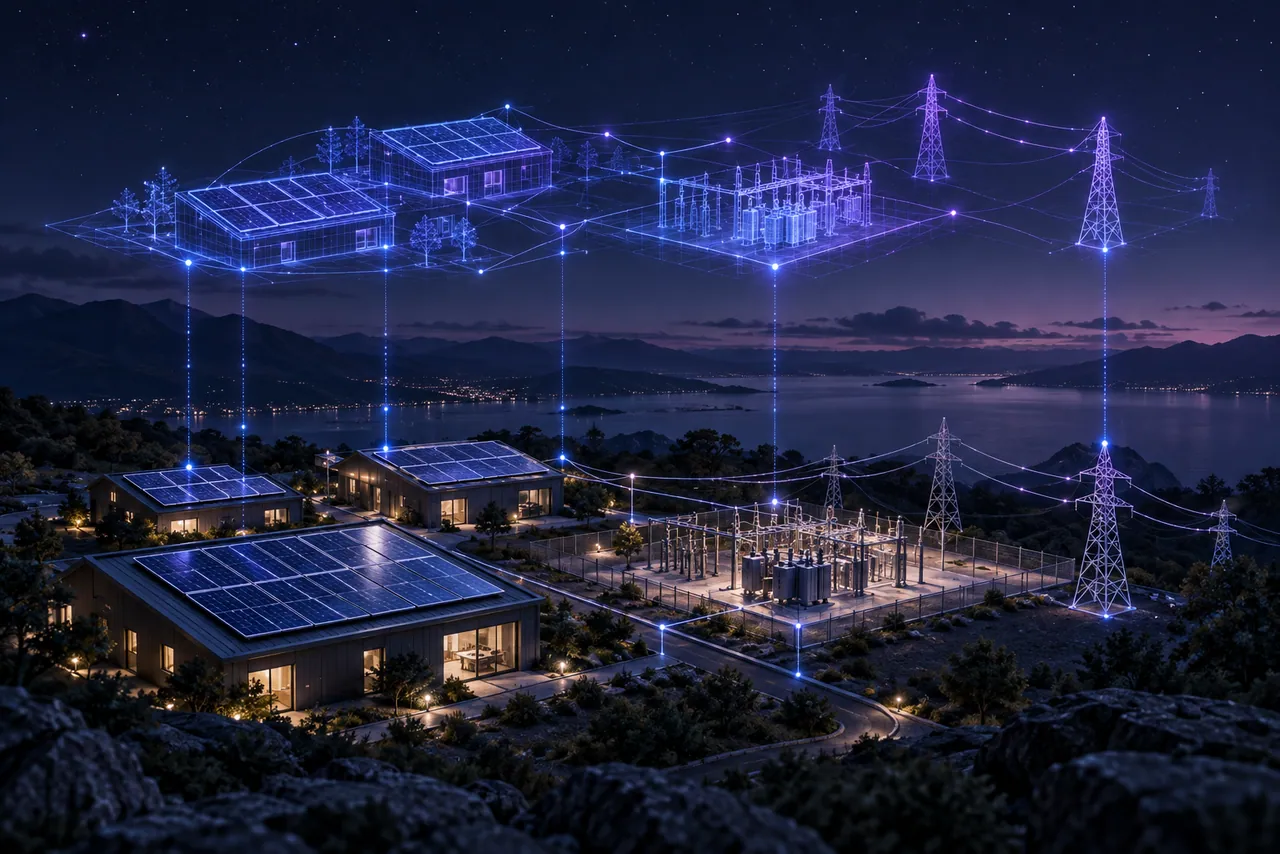
CONNECTED INFORMATION AT WORK
Explore buildings with map or satellite views, grid overlays, points of interest and rooftop coverage.
Estimate solar production and explore panel orientation and tilt for a selected building.
Adjust costs, the energy used on site, battery storage, energy prices and carbon assumptions to compare scenarios.
WHAT WE BUILD FOR ENERGY TEAMS
Our energy solutions extend this connected approach across your infrastructure, bringing asset, grid, weather, operational and market information together.
Forecast demand, generation and system stress across scenarios.
Turn patterns in asset information into maintenance priorities.
Keep asset conditions and alerts visible in one operating picture.
Connect forecasts and market exposure to strategy review and trading decisions, with human approval.
Compare siting, capacity and grid-connection scenarios before investment.
Maintain a living model of assets, relationships and current and historical data to test consequences before action.
A REVIEWABLE OPERATING LOOP
Bring assets, relationships and evidence into a shared model.
Explore possible consequences with assumptions visible.
Give accountable teams the context to plan and act.
BUILD YOUR NEXT CHAPTER
Start with one asset, process or planning question.