01
Monitor
See network conditions in a shared operational view.
Energy & Utilities
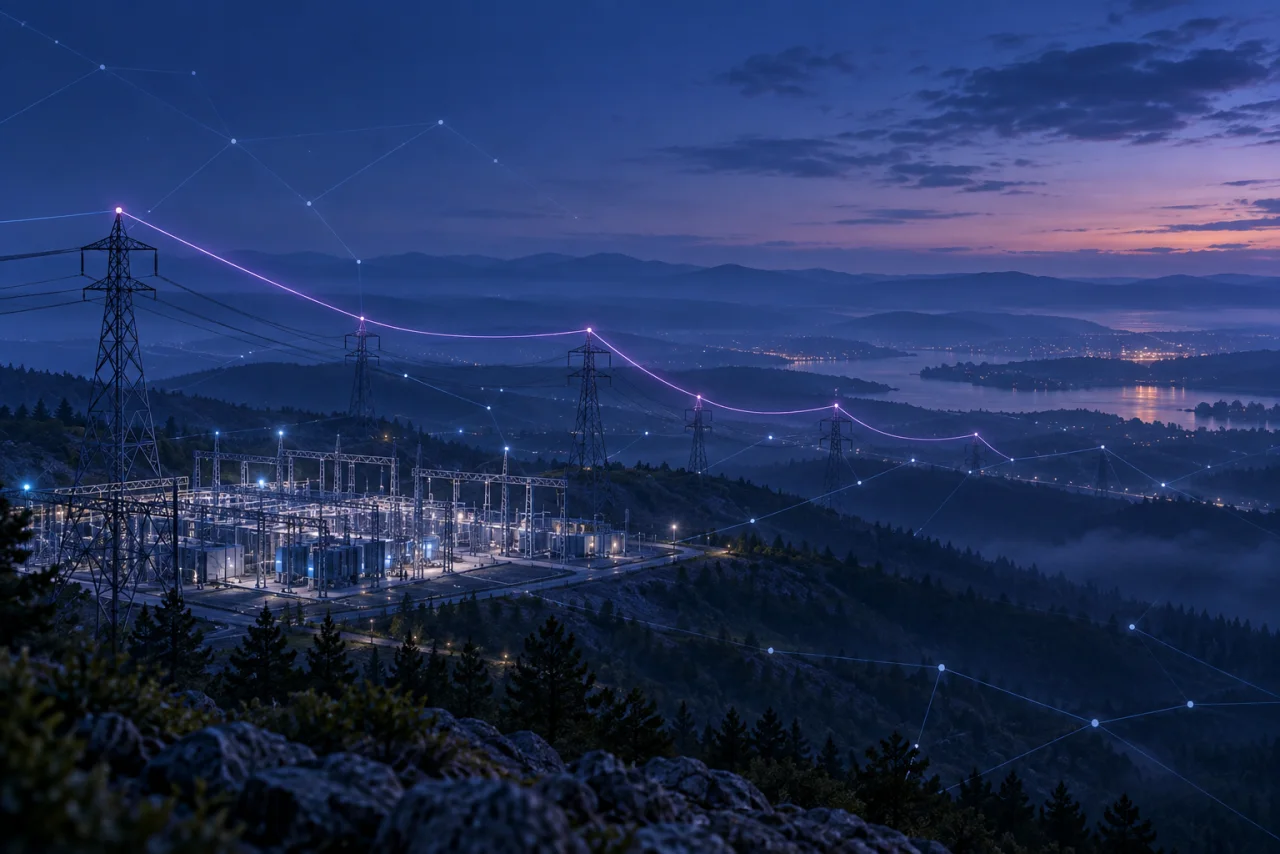
As renewable generation, electric vehicles and heat pumps change the demands on an electricity network, an energy and utilities provider needs to understand what is happening across the system and what a decision could affect next.
The challenge
Traditional monitoring and specialist knowledge made it difficult to see the full picture across a changing distribution network.
Teams needed a way to connect historical patterns, consumption, generation and network structure so that planning could happen with more context.
Aquila · MATCH
The work examined historical patterns, consumption data and generation trends across the electricity distribution environment.
The goal was to find where existing information could support earlier decisions and where teams were still relying on narrow views or manual interpretation.
Phoenix · MERGE
The transformation connected time-based events with the relationships in the grid, creating a shared operational picture that could be explored and extended.
The design was shaped around the customer’s existing infrastructure and the questions operators needed to answer, rather than around a generic dashboard.
Sculptor · CREATE
Training and documentation helped generalist staff work with information that had previously required more specialist interpretation.
See network conditions in a shared operational view.
Explore consumption and generation patterns and flag situations that need attention.
Support reconfiguration, maintenance and investment decisions with connected context.
Outcome
This energy and utilities story shows how connected operational information can help a team move from fragmented signals toward a shared view of the network. The resulting model supports monitoring, predictive analysis, alerts, reconfiguration planning, maintenance scheduling and investment decisions.
BUILD YOUR NEXT CHAPTER
Bring the system, the decisions and the people who need a clearer view.